
Monitor Linux Servers Part 2: How To Install and Configure Node Exporter On a Linux Server

Node Exporter is used to keep track of a number of machine-level metrics, including CPU, memory, disk, and network activities.
- The server firewall has port 9100 open, since Prometheus reads metrics on this port.
- The Prometheus server must be operational for the Prometheus Node Exporter to function. Please refer to the Prometheus setup guide for Linux if you want to set up Prometheus.
How it works
Node Exporter works by exporting machine-level metrics via an HTTP endpoint. It runs as a daemon on the machine it is monitoring, and periodically collects data about various system resources such as CPU utilization, memory usage, disk usage, and network activity.
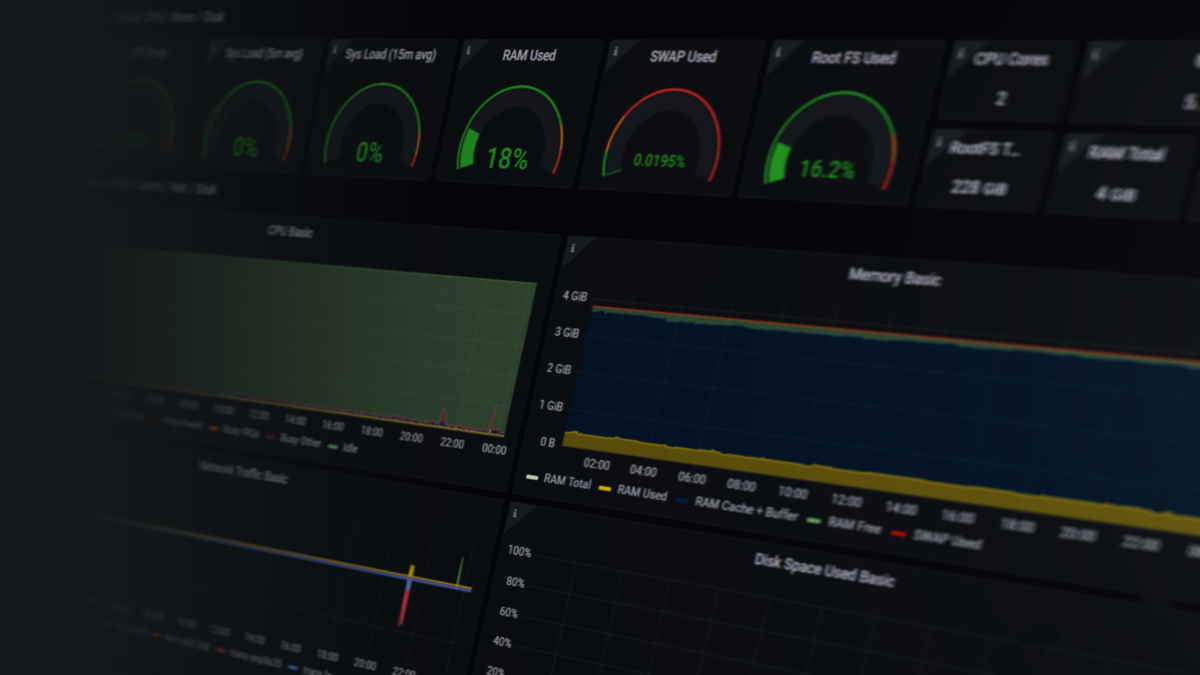
Finally, the data that Prometheus gathers can be visualized using Grafana or another visualization tool.
Deploying Node Exporter using Docker
To run the node exporter service, create a node exporter user.
sudo useradd -rs /bin/false node_exporter
Make a systemd service file called node exporter.
sudo nano /etc/systemd/system/node_exporter.service
[Unit]
Description=Node Exporter
After=network.target
[Service]
User=node_exporter
Group=node_exporter
Type=simple
ExecStart=/usr/local/bin/node_exporter
[Install]
WantedBy=multi-user.target
Star the node exporter service and restart the system daemon.
sudo systemctl daemon-reload
sudo systemctl start node_exporter
sudo systemctl enable node_exporter
Metrics would now be exported via the node exporter on port 9100.
By going to your server's URL at /metrics, as shown below, you may view all the server metrics.
http://<ip-changeme>:9100/metrics
Docker Compose
A docker-compose.yml file that specifies our prometheus and node-exporter services, as well as our monitoring bridge network, will be created by you.
In your preferred editor, open a file called docker-compose.yml, and put the following into it:
version: '3.8'
networks:
monitoring:
driver: bridge
services:
node-exporter:
image: prom/node-exporter:latest
container_name: node-exporter
restart: unless-stopped
volumes:
- /proc:/host/proc:ro
- /sys:/host/sys:ro
- /:/rootfs:ro
command:
- '--path.procfs=/host/proc'
- '--path.rootfs=/rootfs'
- '--path.sysfs=/host/sys'
expose:
- 9100
networks:
- monitoring